2012.5.17
modify: 2012.6.6
Continuous Drawing of the Vibration Mode on Ancient Amphitheater Colosseum in Rome
An example of current situation based on measured microtremor
Yutaka NAKAMURA
System and Data Research Co.,Ltd.
1. Preface
We have investigated the vibration characteristics of ancient amphitheater Colosseum in Rome. In 1997 and 1998, we had conducted microtremor measurement at and around Colosseum with researchers of Rome University. Recently there is a plan to construct a new subway line at northern side of Colosseum, so Italian researchers have investigated detailed analysis with precise numerical model. Here, the result of microtremor measurement in 1997 and 1998 is reanalyzed to grasp the detailed actual vibration characteristics.
A continuous drawing of the vibration mode is conducted on trial to make the vibration characteristics easier to understand. The target of this analysis is mainly the vibration of radial direction on the third and forth rings.
2. Summery of measurement points
The main body of Colosseum had been measured on November 1997 as preliminary search and on July 1998 as main survey.
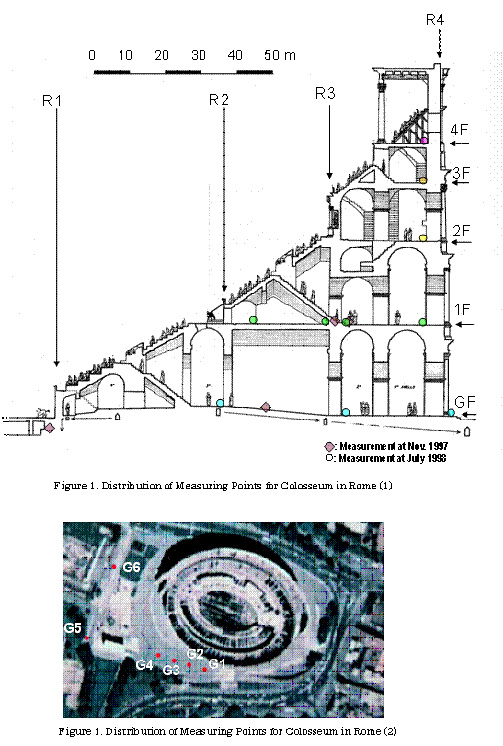
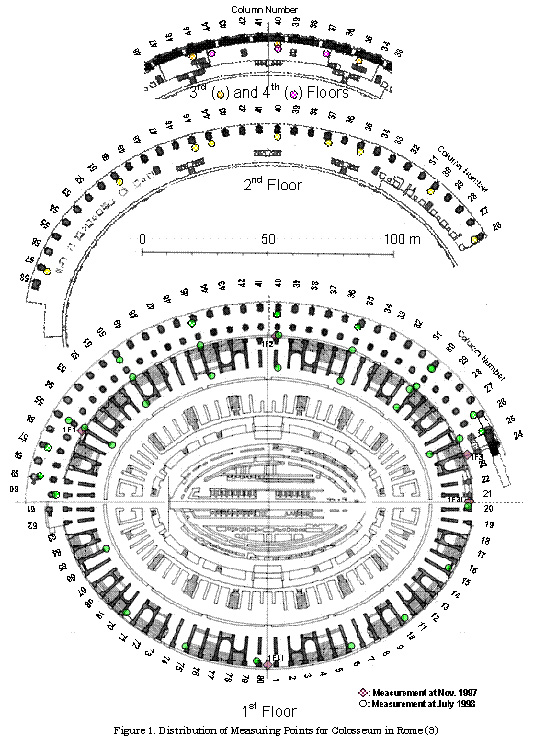
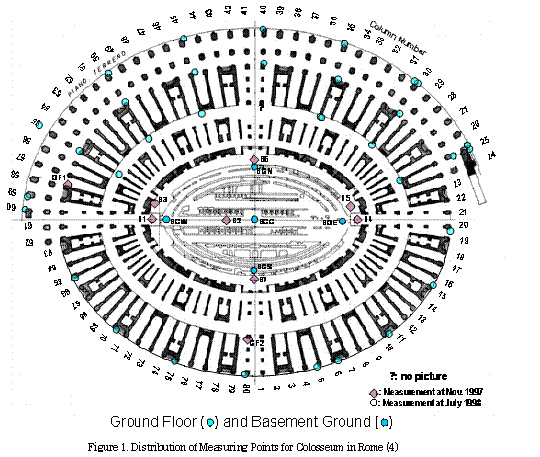
Colosseum has a donuts-shaped basement and consists of ring-shaped structures five stories above ground and one below which has a 80 columns surrounding entire circumference. There are four rings from inner ring (R1) contacting with arena to outer ring (R4) remaining half of the structure. The base ground locating underground of arena and R1 was measured in 1997. Basically microtremor was measured at every five columns and recorded for three components simultaneously at every measurement point. The direction toward to center, circumferential direction and vertical direction are assigned X, Y and Z, respectively. And also the measurement was conducted simultaneously at leas two points to analyze concerning phase.
Figure 1 shows the distribution of the points for microtremor measurement. These points are rechecked with pictures at that time. Then because there was no picture for the measurement points #40 of R2 on the ground level, the location is marked "?". Although there had to be conducted simultaneous measurement between ground level and first floor (second floor in Japan), the measurement has a possibility to be conducted at the next point on the ground level for the error. Even so, because each point are closed to each other and both on hard basement, it has little impact on the result of analysis.
|
|---|
3. Expression of vibration mode
The target of this analysis is radial direction of the third ring (R3) preserving almost perfectly in its original ring form and the forth ring (R4) remaining half of the structure.
(1) Ring R3
The microtremor measurement was conducted simultaneously at ground floor and the first floor close to the outer wall, and the amplification factor is assessed for each measured point in case of uniform input for radial direction. This result is drawn continuously the vibration mode including phase for each frequency sweeping to around 10 Hz. The mark º and • corresponds to the amplitude of direction plus and minus of input motion. It is possible to confirm the vibration mode at each frequency with topping the animation, or confirm the general tendency from the change of the vibration mode with changing the frequency continuously.
A part restored by brick structure (column #70 - #80) starts shaking around 0.88 Hz and next a reinforced part looks huge triangle ruler at the eastern end of the remained outmost ring at 1 Hz. Soon, the reinforced part of the other side of the outmost ring starts moving and then the remaining part of the outmost ring starts vibrating in its entirety in 1.5 - 1.7 Hz. After this frequency, the vibration continues in low level. At 2.5 Hz, the entire part starts shaking. The remaining part of the outmost ring vibrates widely and the phase turns over around the repaired part. Some nodes appear at the location remained outmost ring around 3 Hz and the amplification factor is relative small. The center part without outer wall (column #0) vibrates widely around 3.3 Hz, and this vibration is opposite phase for the point #60. The amplification factor around the point #70 shows large value around 4.5 Hz and reaches to the maximum value at about 4.7 Hz. At this moment, the part without outmost ring shows large amplification factor mostly at western part, and especially extremely large value is shown at 4.5 Hz around the point #70, the border between the part repaired by brick and the original structure. After that the eastern part, lower part in the animation, is shaken entirely and many nodes are appeared at the western part. These nodes are propagated to the whole structure and complex vibration mode is seen in 5.4 Hz. The vibration becomes large around the northern point #0 and moves into relative uniform mode in 5.7 Hz. Western side facing the triumphal gateway starts shaking widely around 7Hz. Because subway tunnel runs through this side, the vibration mode excited by the high frequency predominated by the subway vibration is worried. The amplification factor between the points #0 and #20 shows relative small value at the high frequency range, over 20 Hz, and this fact may shows that the structure in this portion is relative healthy.
(2) Ring R4
Ring R4 was measured from the ground level to the fourth floor (fifth floor in Japan) depending on the preserved situation. Because two floors were measured simultaneously, vibration mode of vertical component can be analyzed concerning phase. So, vertical vibration mode for each column number is shown in addition to horizontal vibration mode. Horizontal vibration mode is color-coded according to the layer.
Around remaining western end #25 is widely shaken at around 1Hz and then the opposite end #60 is widely shaken at around 1.3Hz. Soon the vibration of the central tall part starts and reaches its peak at 1.6Hz. It is interesting that the vertical vibration at #45 remaining fourth floor, #45 and #35 are differ subtly from each other. After that, it is also interesting to be seen the situation of generation and propagation of various nodes both in vertical component and horizontal plane.
In addition, because a vibration around #25 at 1 Hz causes large story drift, it is thought that this portion may be one of weakness at a time of earthquake. An elevator for handicapped was found at a time of 2010 revisit in this portion. The animation of vibration mode shows resonance phenomenon exciting this portion at around 20 Hz. A vibration from the equipment is worried about the effect for the structure.
4. Conclusion
Because vibration mode reflects the condition of not only base ground but also a shape and a rigidity of a structure, it is possible to learn a lot from detailed observation or investigation of the situation. Continuous drawing of vibration mode makes available to grasp the vibration characteristics more visually and precisely. Additionally, combined with the result of precise numerical model analysis, it may possible to be able to understand particularly the current condition of various structures by microtremor measurement. It is expected to be constructed a new method or knowledge on rational preservation for world cultural heritage.
On the other hand, it is difficult to understand the effect of the earthquake motion only from the vibration mode of radial direction. However, the higher the frequency, the smaller the deformation against the earthquake motion (inertia force) drastically inversely to the square. So it is possible to concern that the portion amplified largely in low frequency range must be the weak point against earthquake motion. For example, the area around #25 must be a weak point against a vibration around 1 Hz.
From this viewpoint, animations noticing the story drift will be created to express visually the effect on each frequency for the next step.
References
Nakamura, Y., Saita, J., Rovelli, A. and Donati, S. (1998) "Seismic response of roman Colosseum and its foundation by using micro-tremor measurement", The 10th Japan Earthquake Engineering Symposium, pp. 2625-2630. (in Japanese)<1997 measurement>
Nakamura, Y., Gurler, E. D., Saita, J., Rovelli, A. and Donati, S. (2000) "Vulnerability investigation of roman Colosseum using microtremor", 12WCEE2000, paper#2660.<1998 measurement>
Nakamura, Y. (2011) "The H/V Technique abd Example of its Amplication for L'Aquila and Rome Area", Proceeding of the workshop DISS_10, L'Aquila, 19 March 2010.